Solid Baffle
Contents
New Idea
New Idea: can we have the baffles straight where the detectors are and more curved near the target? Now the spokes are straight near the target. The detectors would then have a simpler geometry, reducing cost. Anyway, we need a Monte Carlo to check out new ideas. (by Paul Souder?)
Zhiwen's work with geant4 simulation
Verify Eugene baffle acceptance
Eugene's result is at PAC 34 Proposal page 36
condition
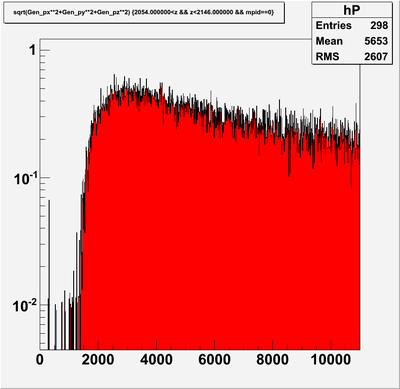
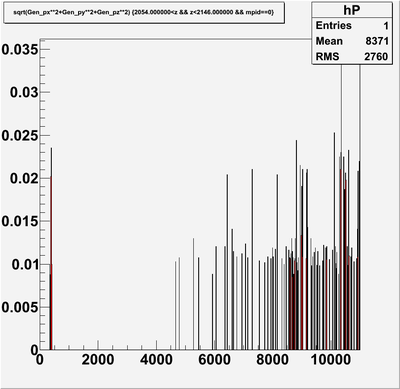
beam e-/gamma/e+, E 0-11GeV, Theta 22-35 degree, Phi 360 degree,
Vertex centered at 10cm, 40cm long full target or point target
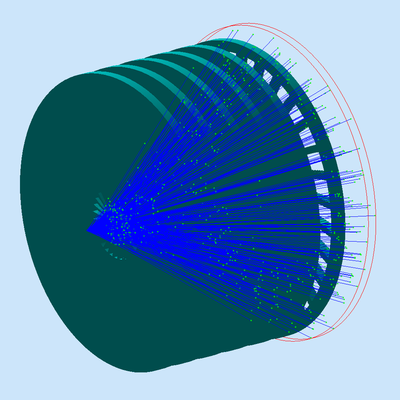
baffle 6 plates, 30 slits per plate, 20 blocks per slit.
baffle plates are located at 30, 60,90,120,150,180 cm.
tracks killed once hit on baffle, observer plate at 210 cm.
FLUX bank was used to determine the average Z vertex, this is not meant to be a very accurate vertex, but good enough to tell the hits on which plate.
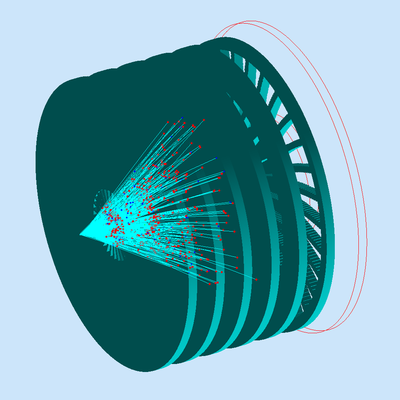
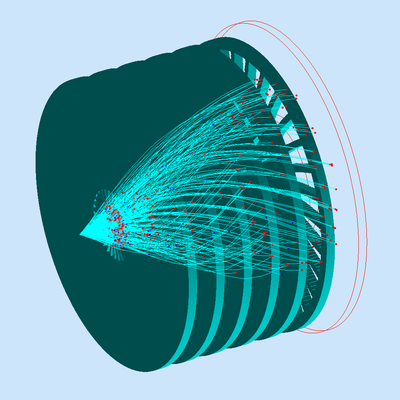
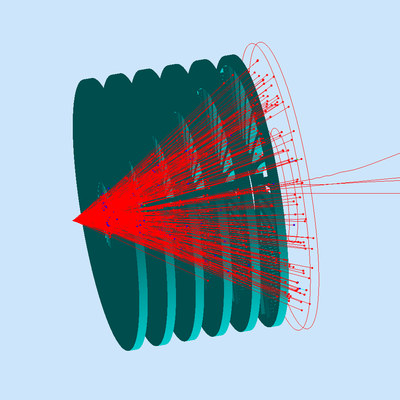
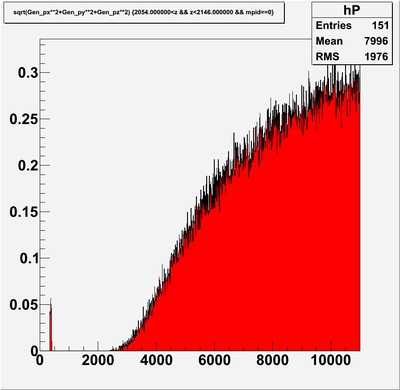
beam e- with full target
beam e- with point target
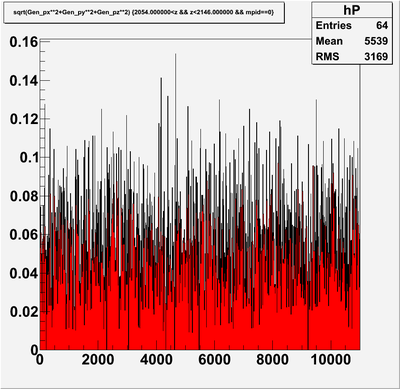
beam e+ with full target
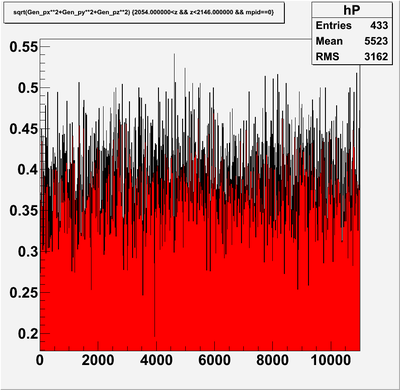
beam gamma with full target
result and questions
- the results are different from what Eugene had
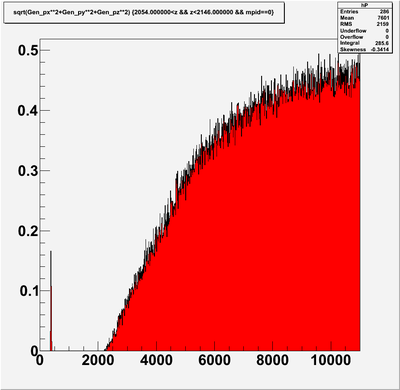
- Eugene's result is flat between 40-50%, we have point target result flat at 40-50%, full target at 30%-40%. But according to the proposal, I think Eugene simulate the full target.
- Eugene's electron result drops slower below 2GeV. But ours drop to 0 at 2GeV. for example, at beam 1.5GeV, all tracks are blocked as shown the hit plot.
- at beam 0.38GeV, we have some acceptance as shown in the hit plot. Eugene's plot doesn't show P<0.5GeV, so we don't know what he had.
- Eugene has pion result also. I guess it's negative pion, but it should have the result like electron because magnetic bending doesn't care mass, only charge. So did Eugene have detailed physics in simulation?
- neutron particle is not blocked well, 40% acceptance.
- positive particle has acceptance about 20-30%
note about Eugene's study
- The acceptance study has real physics turned on and is studied at forward EC plane, so e/pi has different results
- photon acceptance should be less than some percent level, so the current setting has problem.
Verify Eugene baffle acceptance again after correction
additional rotation
After Seamus identify the needed rotation, we added those line in the baffle description perl script.
my @offset =(-5.6, -4.4, -3.3, -2.1, -0.9, 0.1);
my $slit_rotation = ($i-1)*12-$offset[$n-1];
now the results look reasonable
additional shift
move to 30,58,86,114,142,170. refer to http://hallaweb.jlab.org/12GeV/SoLID/download/sim/geant3/solid_comgeant_pvdis/pvdis_02_01_p_14_01/fort.22
picture ....
Seamus's work with geant4 simulation
Reproduction of Eugene's baffles in GEMC: [1]
First attempt at a new baffle design: [2]
Other magnet baffles in GEMC: [3]
good new baffle designs in GEMC: [4]
CDF compare http://hallaweb.jlab.org/12GeV/SoLID/download/baffle/CDFcompare.png
Eugene's work with geant3 simulation
Eugene's procedure
the slits were defined using the following procedure:

a) I ran GEANT simulating production in a long target,
   at the edges of a phi-theta sector. The sector
   width was 5 deg at thet_min and 9 deg at thet_max.
   At the low phi edge (against the rotation in the field),
   I took the max XBj and calculated the momentum for the given
   theta. At the higher edge I took the min XBj.

b) GEANT generated hits of these tracks in the planes of the baffles.
   The target length in Z makes things a bit complex, but it turned
   out that simple rules could be used to select the most inner
   points for the given R.
   I took the hits and extrapolated the phi-R curves with parabolas
   as phi=p0+p1*r+p2*r**2.
   The results were stored in the PAW session.

c) Using the stored parameters of the baffles, I printed
   the input to GEANT, splitting the holes in the baffles into
   about 20 rings.

It was not possible to define a slit as a single shape in GEANT3.
I do not know about GEANT4. It would be a complex slice of a paraboloid,
overlapping with other volumes.
Multiple volumes work well in GEANT. One slit was defined,
then copied to all 30 sectors of the given ring. This part of the FFREAD input
code defining the geometry was generated by a script (too many lines to type
by hand).
The plots in a pdf file and results in a kumac
6 plates, 30 slits per plate, 20 blocks per slit
In PVDIS PAC34 proposal, page 35 (http://hallaweb.jlab.org/collab/PAC/PAC34/PR-09-012-pvdis.pdf). It's mentioned that the baffle position is 30,60,90,120,150,180cm relative to BaBar solenoid coil center at 0. But it's actually relative to the target center which is at 10cm as seen on the Fig 3.3 on page 31.
Later on, it seems Eugene has further tweaked them to 30,58,86,114,142,170. refer to http://hallaweb.jlab.org/12GeV/SoLID/download/sim/geant3/solid_comgeant_pvdis/pvdis_02_01_p_14_01/fort.22
This requires addtional rotations of -5.6, -4.4, -3.3, -2.1, -0.9, and 0.1 degrees for plates 1-6, respectively (by Seamus)
 macro baffle xmin=-100 xmax=100 ymin=-100 ymax=100

   application data tmp.dat
   3.90    5.44   176.26  183.00
   5.44    6.98   176.44  182.13
   6.98    8.52   176.61  181.67
   8.52   10.06   176.75  181.78
   10.06   11.60   176.89  181.90
   11.60   13.14   177.03  182.01
   13.14   14.68   177.18  182.12
   14.68   16.22   177.32  182.24
   16.22   17.76   177.46  182.35
   17.76   19.30   177.60  182.46
   19.30   20.84   177.74  182.58
   20.84   22.38   177.88  182.69
   22.38   23.92   178.02  182.80
   23.92   25.46   178.16  182.92
   25.46   27.00   178.30  183.03
   27.00   28.54   178.44  183.15
   28.54   30.08   178.58  183.26
   30.08   31.62   178.72  183.37
   31.62   33.16   178.86  183.49
   33.16   34.70   179.00  183.60
   tmp.dat

   v/del radmin,radmax,thmin,thmax
   v/read radmin,radmax,thmin,thmax tmp.dat
   exec plotWedge same=[same] color=1 xmin=[xmin] xmax=[xmax] ymin=[ymin] ymax=[ymax]
* wait

   application data tmp.dat
   15.30   17.25   175.93  182.78
   17.25   19.20   176.14  182.56
   19.20   21.15   176.35  182.36
   21.15   23.10   176.58  182.19
   23.10   25.05   176.81  182.05
   25.05   27.00   177.06  181.93
   27.00   28.95   177.28  181.98
   28.95   30.90   177.46  182.12
   30.90   32.85   177.64  182.26
   32.85   34.80   177.82  182.41
   34.80   36.75   178.00  182.55
   36.75   38.70   178.18  182.70
   38.70   40.65   178.35  182.84
   40.65   42.60   178.53  182.98
   42.60   44.55   178.71  183.13
   44.55   46.50   178.89  183.27
   46.50   48.45   179.07  183.41
   48.45   50.40   179.25  183.56
   50.40   52.35   179.42  183.70
   52.35   54.30   179.60  183.84
   tmp.dat

   v/del radmin,radmax,thmin,thmax
   v/read radmin,radmax,thmin,thmax tmp.dat
   exec plotWedge same=[same] color=2 xmin=[xmin] xmax=[xmax] ymin=[ymin] ymax=[ymax]
* wait

   application data tmp.dat
   26.60   28.96   175.71  182.49
   28.96   31.32   175.95  182.40
   31.32   33.68   176.20  182.32
   33.68   36.04   176.46  182.27
   36.04   38.40   176.73  182.23
   38.40   40.76   177.02  182.22
   40.76   43.12   177.31  182.22
   43.12   45.48   177.62  182.23
   45.48   47.84   177.93  182.28
   47.84   50.20   178.15  182.46
   50.20   52.56   178.36  182.63
   52.56   54.92   178.58  182.81
   54.92   57.28   178.80  182.98
   57.28   59.64   179.01  183.16
   59.64   62.00   179.23  183.33
   62.00   64.36   179.45  183.51
   64.36   66.72   179.67  183.68
   66.72   69.08   179.88  183.85
   69.08   71.44   180.10  184.03
   71.44   73.80   180.32  184.21
   tmp.dat

   v/del radmin,radmax,thmin,thmax
   v/read radmin,radmax,thmin,thmax tmp.dat
   exec plotWedge same=[same] color=3 xmin=[xmin] xmax=[xmax] ymin=[ymin] ymax=[ymax]
* wait

   application data tmp.dat
   37.90   40.67   175.38  182.05
   40.67   43.44   175.66  182.04
   43.44   46.21   175.95  182.04
   46.21   48.98   176.25  182.05
   48.98   51.75   176.57  182.08
   51.75   54.52   176.89  182.13
   54.52   57.29   177.22  182.19
   57.29   60.06   177.57  182.27
   60.06   62.83   177.92  182.36
   62.83   65.60   178.29  182.47
   65.60   68.37   178.66  182.66
   68.37   71.14   178.90  182.84
   71.14   73.91   179.15  183.02
   73.91   76.68   179.39  183.22
   76.68   79.45   179.65  183.42
   79.45   82.22   179.90  183.62
   82.22   84.99   180.16  183.84
   84.99   87.76   180.43  184.06
   87.76   90.53   180.71  184.28
   90.53   93.30   180.98  184.51
   tmp.dat

   v/del radmin,radmax,thmin,thmax
   v/read radmin,radmax,thmin,thmax tmp.dat
   exec plotWedge same=[same] color=4 xmin=[xmin] xmax=[xmax] ymin=[ymin] ymax=[ymax]
* wait

   application data tmp.dat
   49.20   52.38   175.06  181.61
   52.38   55.56   175.37  181.64
   55.56   58.74   175.70  181.70
   58.74   61.92   176.04  181.76
   61.92   65.10   176.39  181.84
   65.10   68.28   176.76  181.94
   68.28   71.46   177.13  182.05
   71.46   74.64   177.52  182.17
   74.64   77.82   177.91  182.31
   77.82   81.00   178.32  182.46
   81.00   84.18   178.75  182.63
   84.18   87.36   179.20  182.85
   87.36   90.54   179.48  183.06
   90.54   93.72   179.76  183.28
   93.72   96.90   180.05  183.51
   96.90  100.08   180.35  183.75
   100.08  103.26   180.65  183.99
   103.26  106.44   180.96  184.24
   106.44  109.62   181.27  184.49
   109.62  112.80   181.59  184.75
   tmp.dat

   v/del radmin,radmax,thmin,thmax
   v/read radmin,radmax,thmin,thmax tmp.dat
   exec plotWedge same=[same] color=6 xmin=[xmin] xmax=[xmax] ymin=[ymin] ymax=[ymax]
* wait

   application data tmp.dat
   60.40   63.98   174.92  181.35
   63.98   67.56   175.27  181.43
   67.56   71.14   175.63  181.52
   71.14   74.72   176.00  181.63
   74.72   78.30   176.38  181.75
   78.30   81.88   176.78  181.88
   81.88   85.46   177.18  182.02
   85.46   89.04   177.60  182.18
   89.04   92.62   178.03  182.35
   92.62   96.20   178.47  182.53
   96.20   99.78   178.92  182.73
   99.78  103.36   179.39  182.94
   103.36  106.94   179.88  183.19
   106.94  110.52   180.20  183.43
   110.52  114.10   180.52  183.69
   114.10  117.68   180.84  183.94
   117.68  121.26   181.17  184.21
   121.26  124.84   181.51  184.48
   124.84  128.42   181.86  184.76
   128.42  132.00   182.21  185.04
   tmp.dat

   v/del radmin,radmax,thmin,thmax
   v/read radmin,radmax,thmin,thmax tmp.dat
   exec plotWedge same=[same] color=7 xmin=[xmin] xmax=[xmax] ymin=[ymin] ymax=[ymax]

 return


 macro plotWedge same=' ' color=1  xmin=-100 xmax=100 ymin=-100 ymax=100

   set plci [color]
   if ([same] .eq. ' ') then
     null [xmin] [xmax] [ymin] [ymax]
   endif

   v/del rad
   v/cr rad(21) r
   v/copy radmin rad
   v/copy radmax(20) rad(21)

   DO I = 1, 30
     do j = 1, 20
       thmin = thmin([j])+([i]-1)*12
       thmax = thmax([j])+([i]-1)*12
       arc 0 0 rad([j]) rad([j]+1) [thmin] [thmax]
     enddo
   enddo

   exec plotCompass

 return

 macro plotCompass offset=3 deg=12 radius=300

   ndiv = 360/[deg]
   message [ndiv]

   angle = [offset]
   do idiv = 1, [ndiv]
     angle = [angle] + [deg]
     angleRad=[angle]*3.1415927/180.0
     v/del aneRad,x,y
     v/cr angRad(1) r [angleRad]
     v/cr x(1) r 0
     v/cr y(1) r 0
     sigma x=cos(angRad)
     sigma y=sin(angRad)
     x=x(1)*[radius]
     y=y(1)*[radius]
     line 0 0 [x] [y]
   enddo

 return


